01
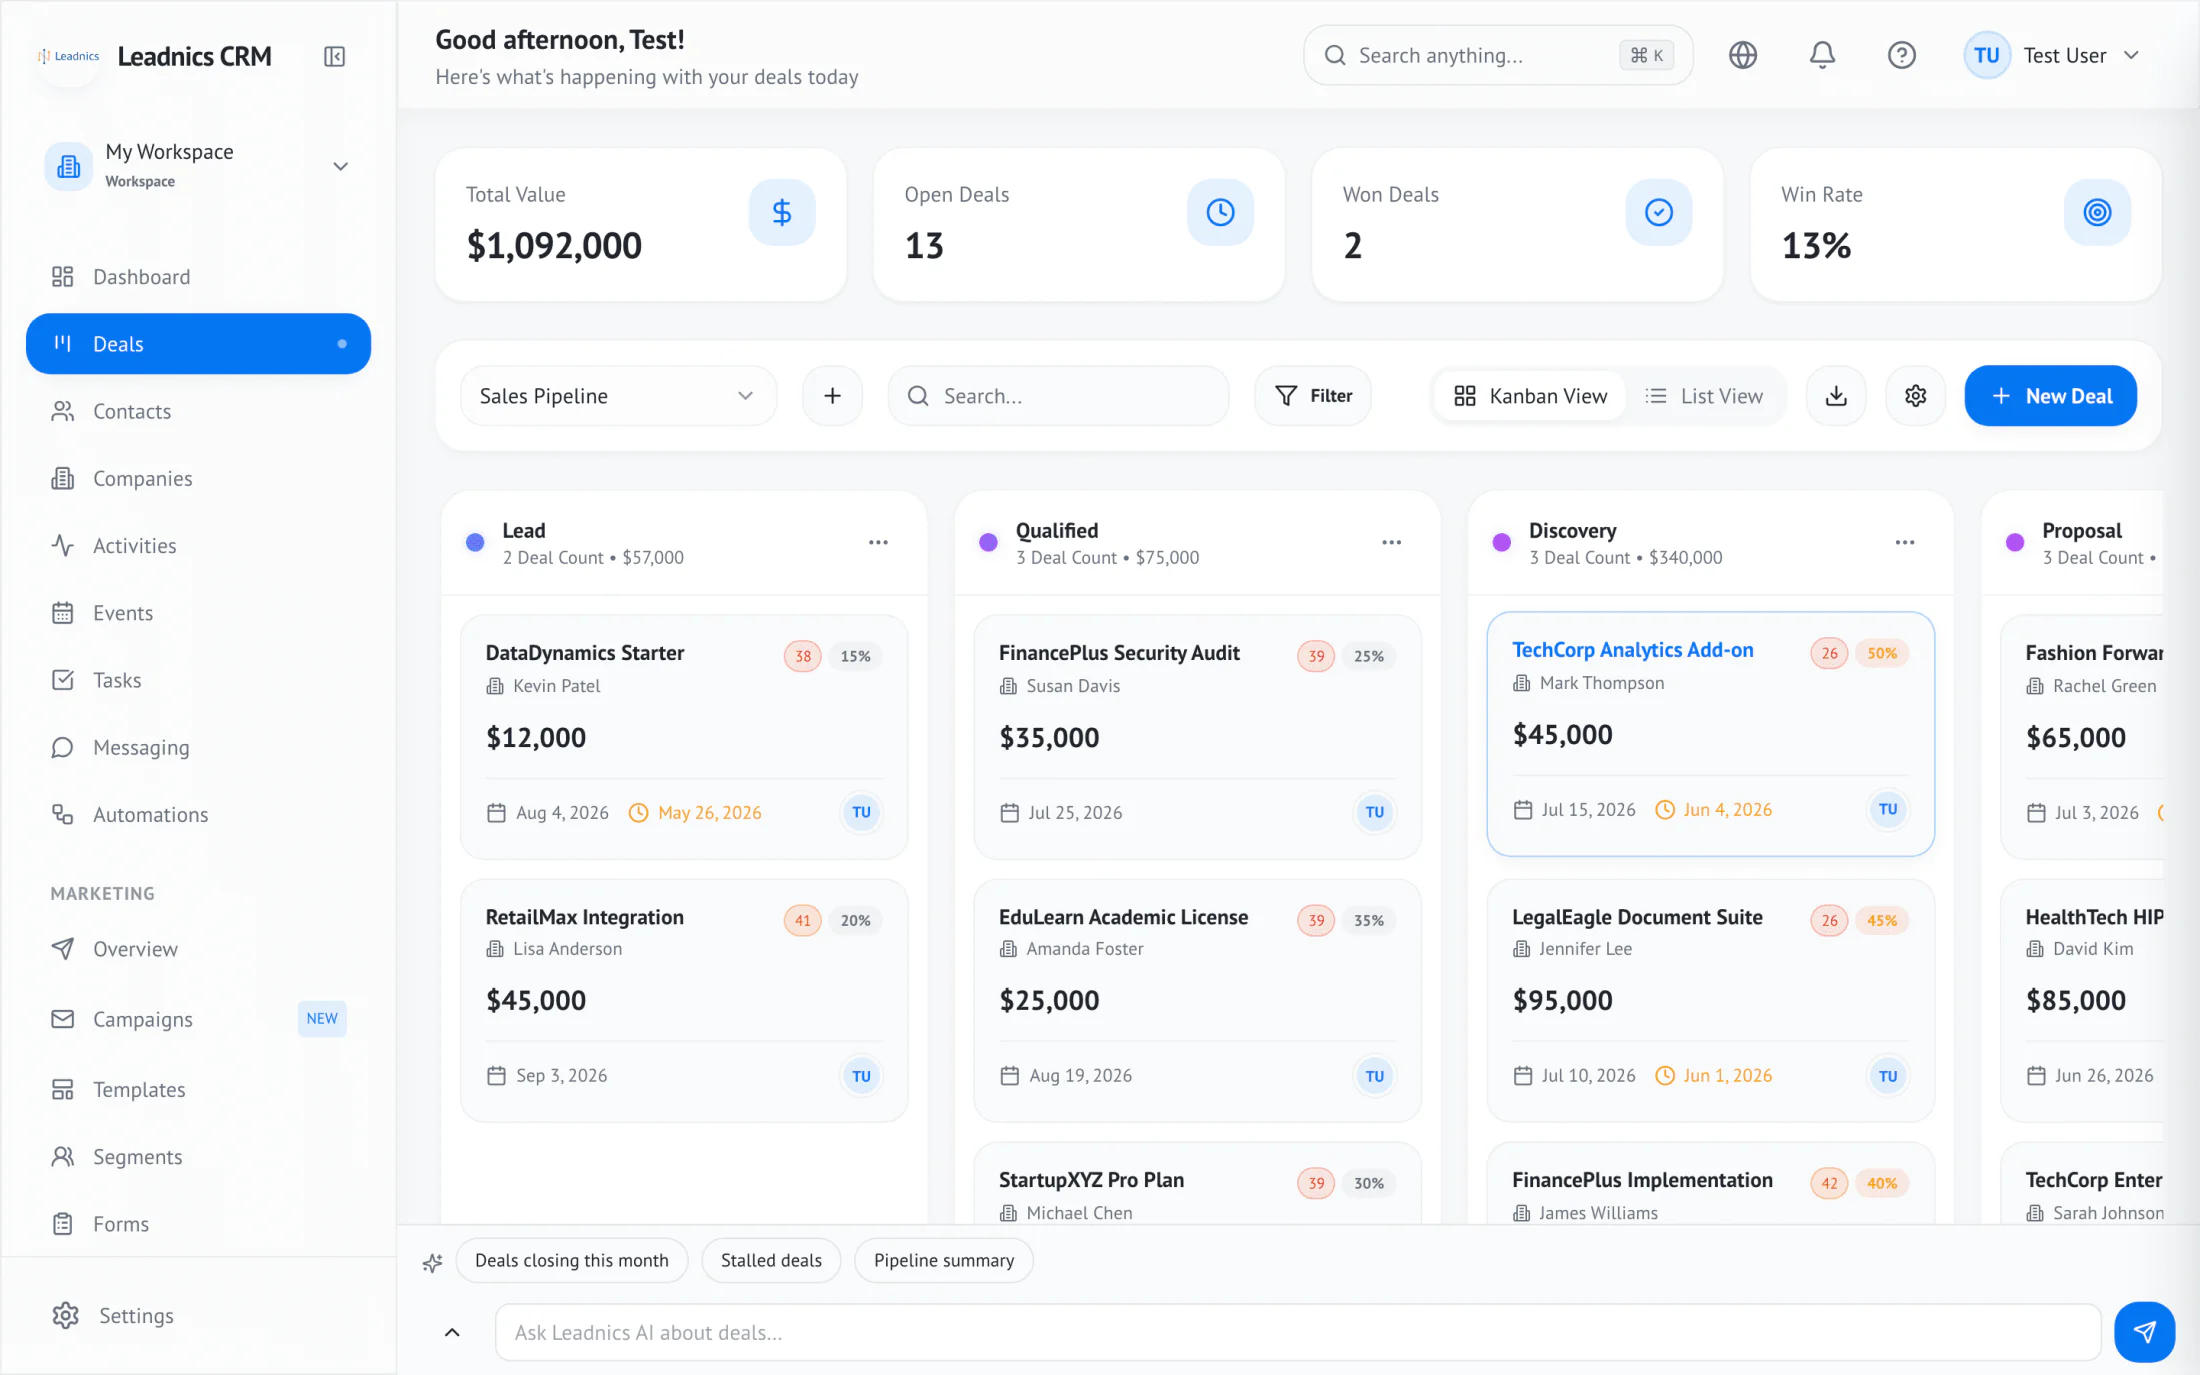
Custom stages
Match your sales process — not a vendor's template.
Product
Drag deals across stages. Forecast by weighted value. See where the team is overcommitted before quarter-end.
How it works
Every scanned card or filled form becomes a deal in the right stage automatically.
Reps drag deals across stages, log notes, schedule next steps without leaving the board.
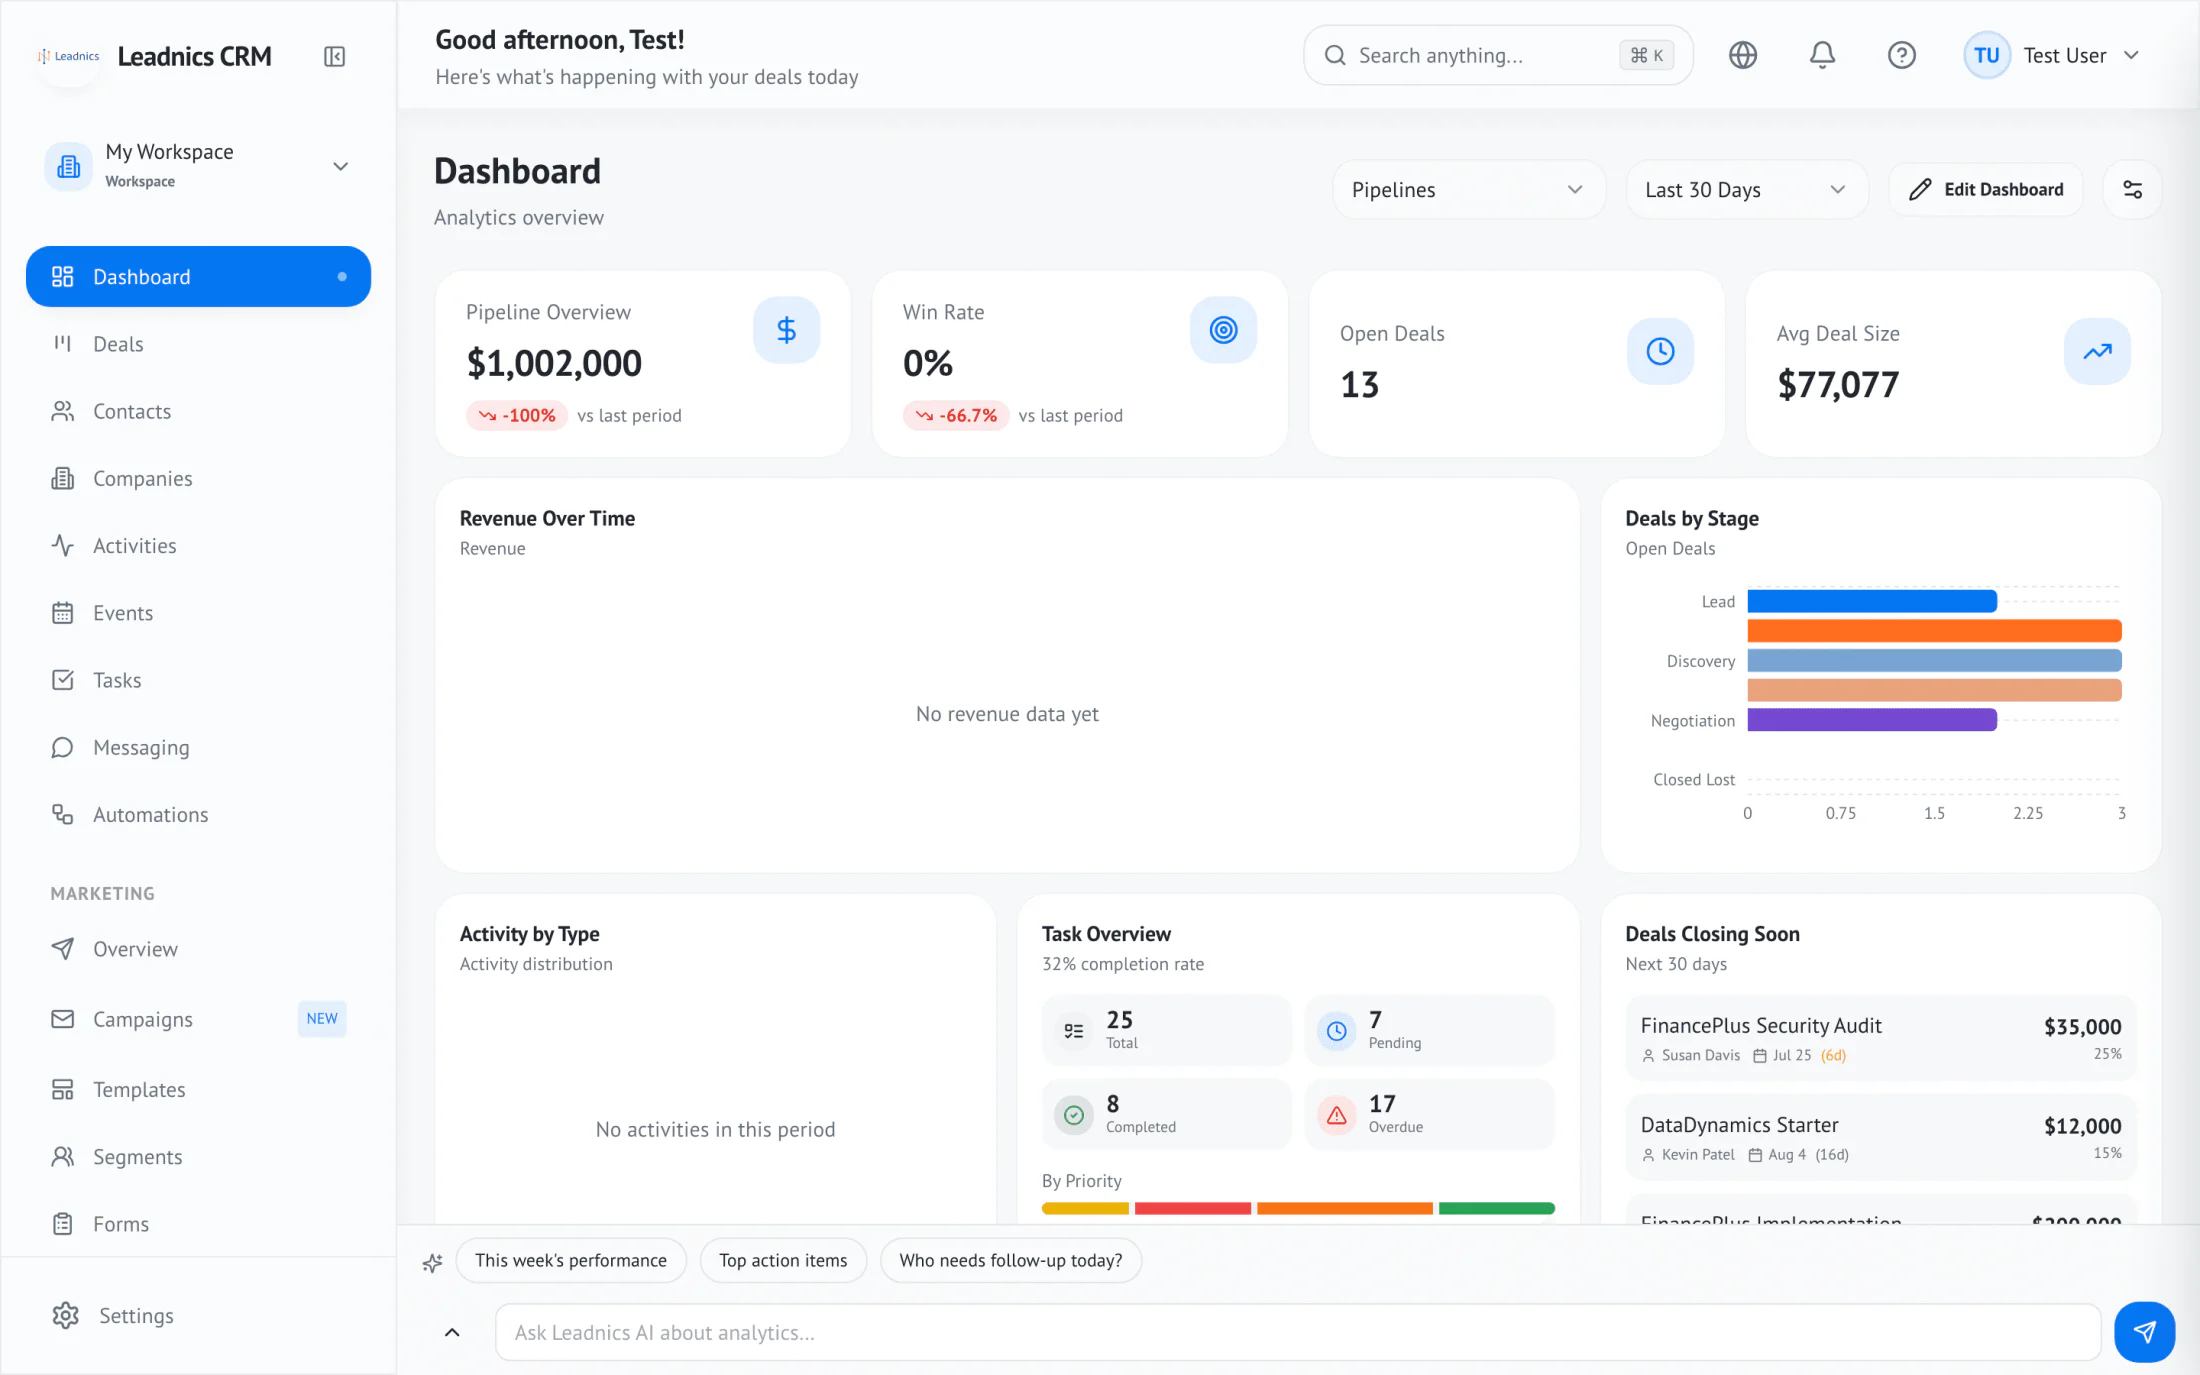
Weighted-value forecasts roll up by team, rep, or stage in real time.
Capabilities
Match your sales process — not a vendor's template.
Each stage carries a probability; quarter view updates in real time.
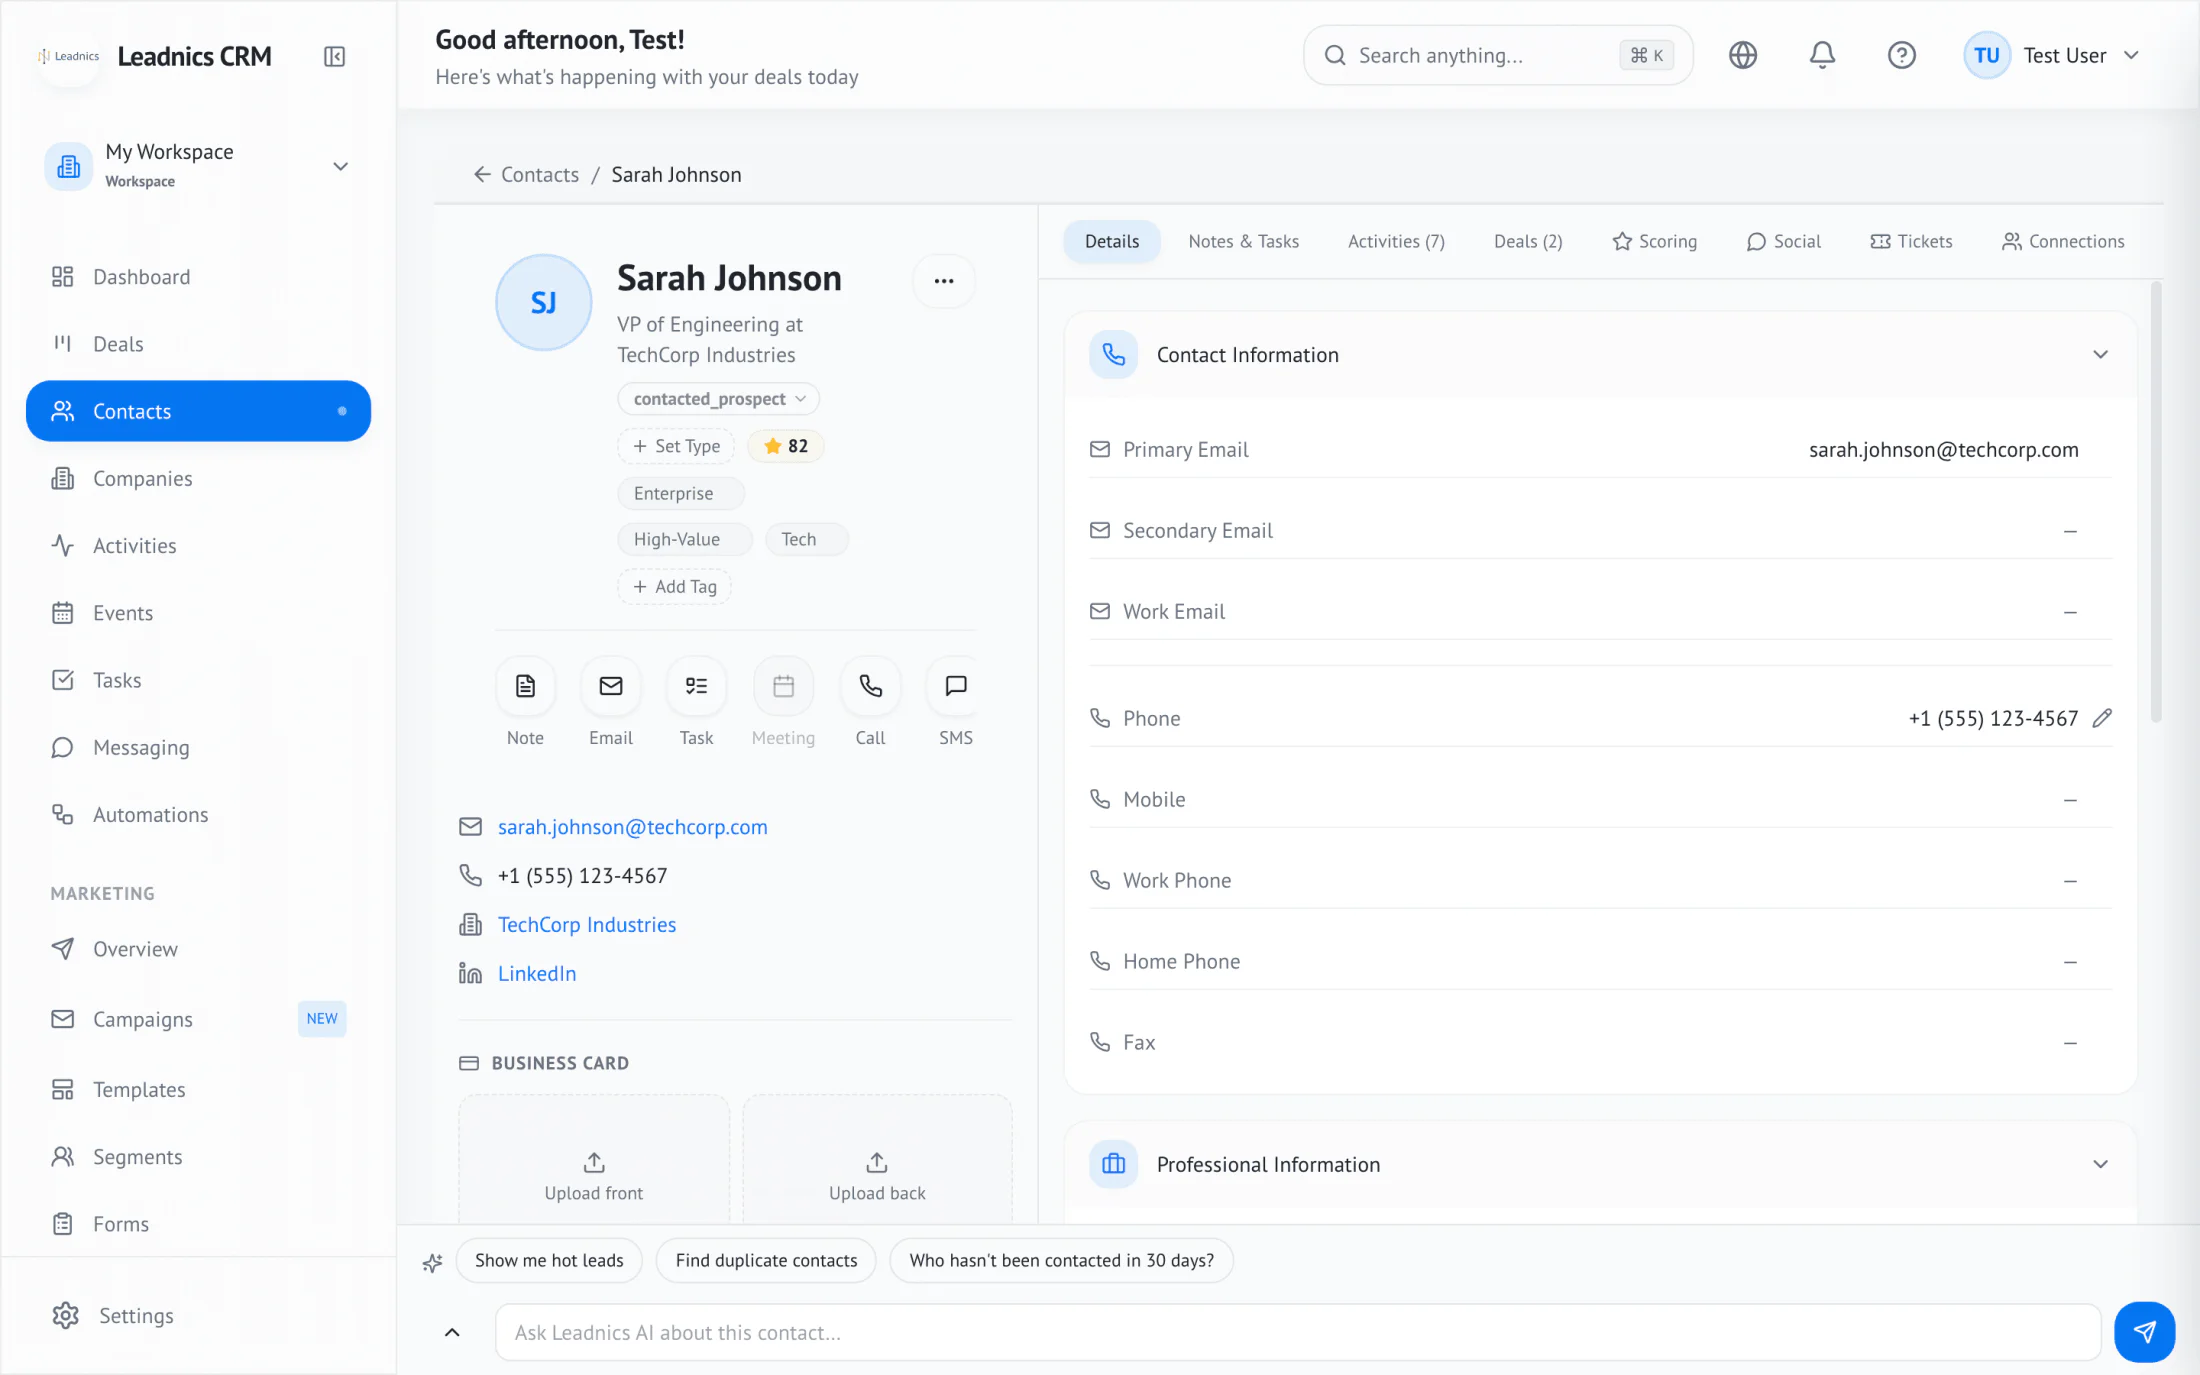
Per-rep boards filter to their own deals; managers see the full team.
Every email, call, and meeting attached to the deal — automatically.
Move 20 deals across stages in one drag.
Average deal size, win rate, time-in-stage by team and segment.
Questions
Yes. Sales, partnerships, renewals — each gets its own pipeline with its own stages.
Each stage carries a probability you set. Open deal value × stage probability = forecast contribution.
Stage rules can auto-tag deals, notify reps, or trigger a re-engagement sequence.